The Most Common Health and Safety Complaints About the Workplace Revealed
benrothwell
Feb 24th, 2020
Employers are required by law to tell workers about health and safety, including the work they do, how risks are controlled and the best ways of providing information. A recent survey we conducted has revealed the most frequent health and safety complaints that arise when employers fail to meet this responsibility.
We surveyed a total of 900 UK workers about their physical workplace environments, finding that although the majority of employees finding their workplace to be safe, more can be done by employers in their approach to health and safety complaints.
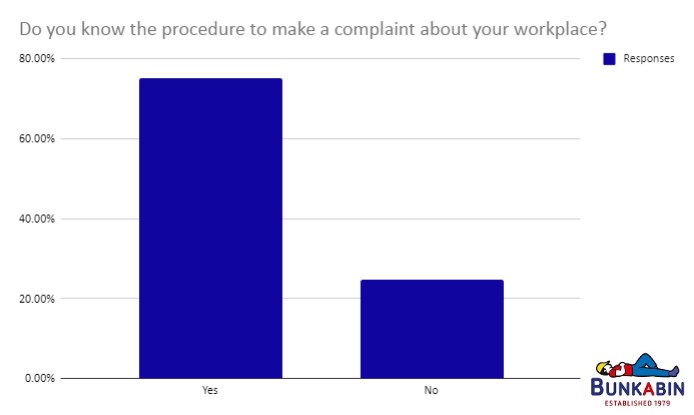
A quarter of UK workers do not know how to make a health and safety complaint
According to the survey, a quarter of workers in the UK are not familiar with the procedure to make a complaint relating to health and safety risks in the workplace, despite it being a legal requirement.
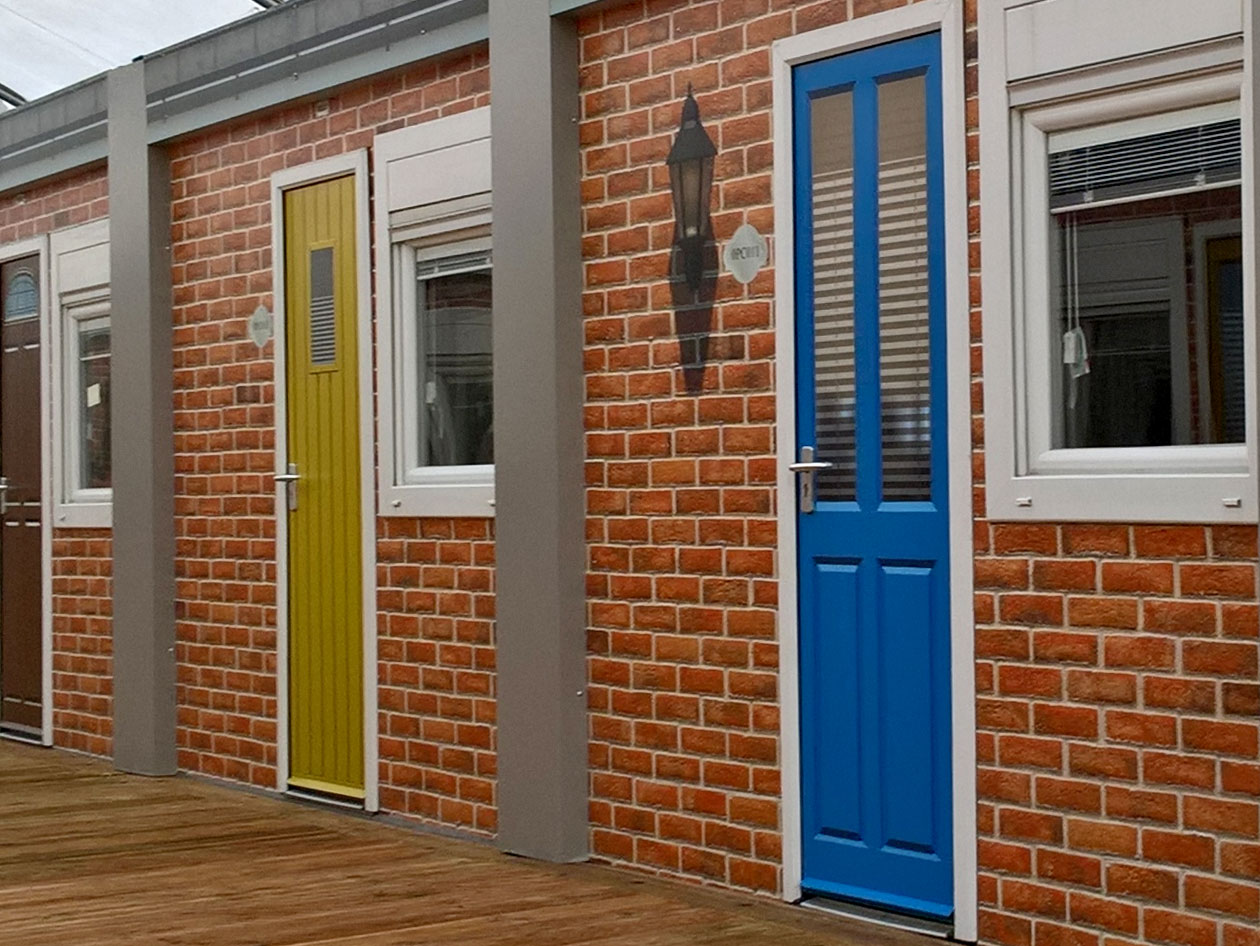
As part of HSE regulations, an approved health and safety law poster must always be on display in the workplace, or each worker must be provided with the equivalent in leaflet form.
One-in-six workers have made a health and safety complaint about their workplace
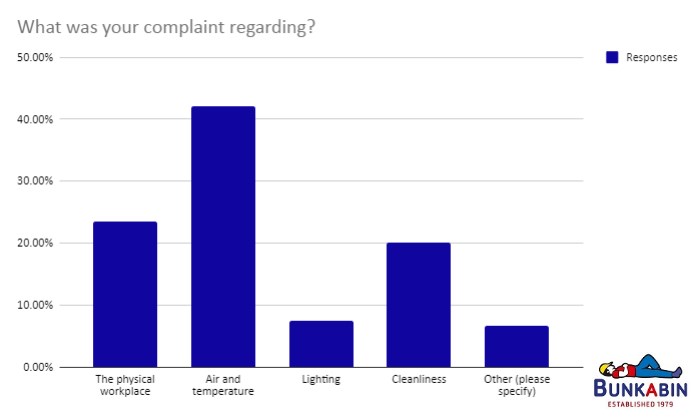
The survey also revealed that 17% of UK workers have made complaints about their workplace, with the most common complaints raised being about the air quality and temperature (42%), followed by the physical workplace (24%) and cleanliness (20%).
We also requested data on the number of complaints made to the HSE about working conditions between 2016 and 2019, and our analysis found that the most frequent subject of complaints was toilet facilities, with a total of 2,987 complaints.
A different survey conducted by Bunkabin in 2019 found that 47% of workers think their employers could do more to improve their toilet and shower facilities, while 28% said their workplaces feature toilets that are not separate and lockable, and 8% work in locations with no toilet facilities at all.
Other common reasons for raising complaints to the HSE included excessive noise (898), lack of canteen/restaurant/eating facilities (471), and damp (463). To read more about the complaints to the HSE, read this blog post.
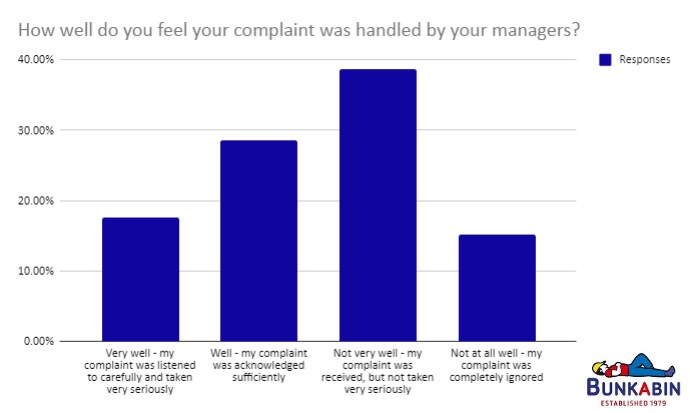
The majority of complaints are not taken seriously
Of the survey respondents who made a complaint about their workplace, the most people (38%) said they felt it was not taken seriously, while 15% said it was completely ignored. Only 18% said that their complaint was listened to carefully and taken very seriously.
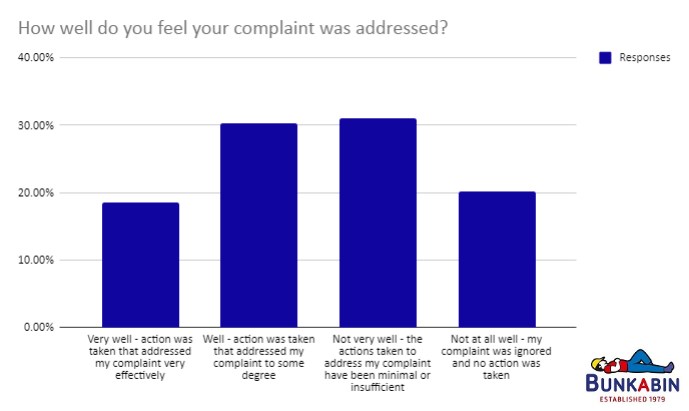
In relation to the action taken following their complaint, 31% said it was not very well addressed, i.e. the actions taken to address the complaint were minimal or insufficient, while 20% said their complaint was completely ignored and no action was taken.
Workers most concerned about the temperature in the workplace
When asked to rate the importance of certain physical factors in a work environment from one to nine, the majority of participants chose comfortable temperatures as the greatest concern (42%). This was followed by air quality (16%) and comfortable acoustics and lighting, both receiving 12% of the vote.
The Workplace (Health, Safety and Welfare) Regulations 1992 place a legal obligation on employers to provide a ‘reasonable’ temperature in an indoor workplace. It is advised that the minimum temperature in a workplace should be 16℃; however, this can be 13℃ for those where the work involves rigorous physical effort.
It is not possible to provide a figure for the maximum temperature in a workplace, as various circumstances mean it cannot be controlled, for example, in glass-works or a foundry. In such environments, appropriate measures should be put in place to make it possible to work safely.
When ranking their greatest concerns, workers expressed that they are least concerned with having a connection to nature in the workplace (32%), as well as fitness facilities (28%) and tech-based health tools (20%).
The full survey data
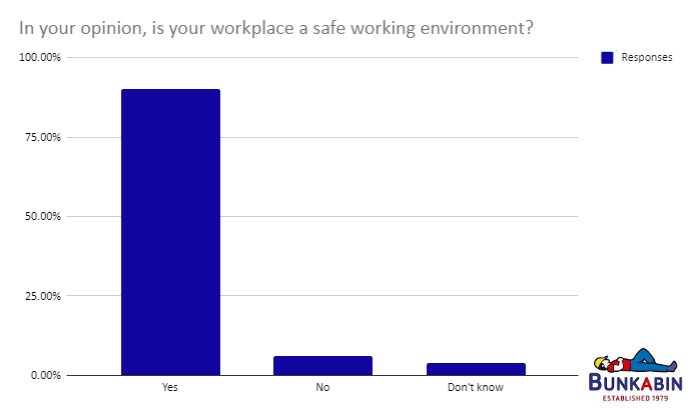
In your opinion, is your workplace a safe working environment?
Answer Choices
Responses
Yes
90.13% (767)
No
6.11% (52)
Don't know
3.76% (32)
Rank the following workplace perks from 1-9 in terms of importance to you, with 1 being the most important
Comfortable acoustics
Healthy food options
Fitness facilities
Tech-based health tools
Air quality
Comfortable lighting
Water quality
Comfortable temperatures
Connection to nature
1
12.38% (89)
3.76% (27)
2.92% (21)
2.78% (20)
16.27% (117)
12.24% (88)
4.59% (33)
41.86% (301)
3.20% (23)
2
11.40% (82)
9.32% (67)
1.67% (12)
2.09% (15)
17.94% (129)
24.76% (178)
12.38% (89)
17.80% (128)
2.64% (19)
3
12.80% (92)
6.54% (47)
7.65% (55)
2.78% (20)
21.70% (156)
22.11% (159)
12.10% (87)
11.68% (84)
2.64% (19)
4
14.46% (104)
7.23% (52)
4.31% (31)
12.66% (91)
15.02% (108)
13.21% (95)
18.64% (134)
8.07% (58)
6.40% (46)
5
18.92% (136)
11.96% (86)
5.98% (43)
6.40% (46)
13.77% (99)
7.37% (53)
20.17% (145)
5.01% (36)
10.43% (75)
6
12.80% (92)
21.84% (157)
7.93% (57)
12.66% (91)
8.48% (61)
10.71% (77)
7.23% (52)
1.95% (14)
16.41% (118)
7
8.21% (59)
20.58% (148)
16.55% (119)
16.27% (117)
3.34% (24)
5.15% (37)
15.02% (108)
1.67% (12)
13.21% (95)
8
5.42% (39)
11.68% (84)
25.45% (184)
24.06% (173)
2.36% (17)
2.92% (21)
6.40% (46)
9.04% (65)
12.66% (91)
9
3.62% (26)
7.09% (51)
27.54% (198)
20.31% (146)
1.11% (8)
1.53% (11)
3.48% (25)
2.92% (21)
32.41% (233)
Score
5.64
4.37
3.09
3.37
6.51
6.45
5.28
7.08
3.22
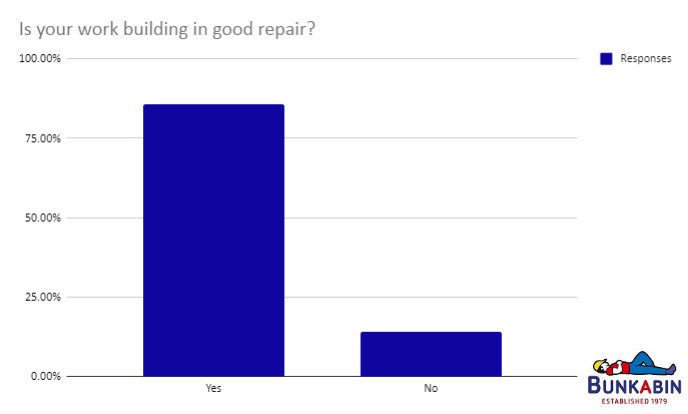
Is your Work building in good repair?
Answer Choices
Responses
Yes
85.81% (617)
No
14.19% (102)
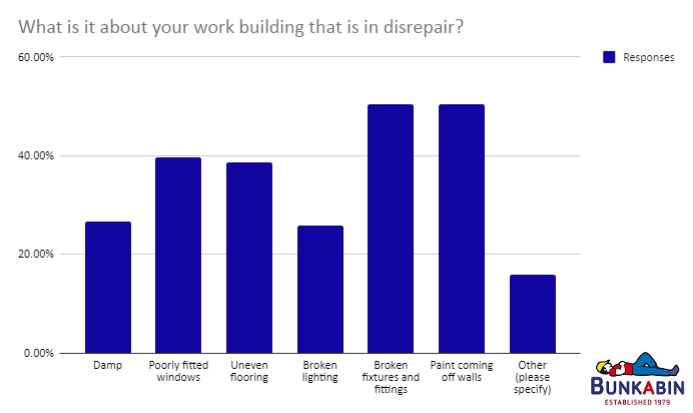
What is it about your work building that is in disrepair?
Answer Choices
Responses
Damp
26.73% (27)
Poorly fitted windows
39.60% (40)
Uneven flooring
38.61% (39)
Broken lighting
25.74% (26)
Broken fixtures and fittings
50.50% (51)
Paint coming off walls
50.50% (51)
Other
15.84% (16
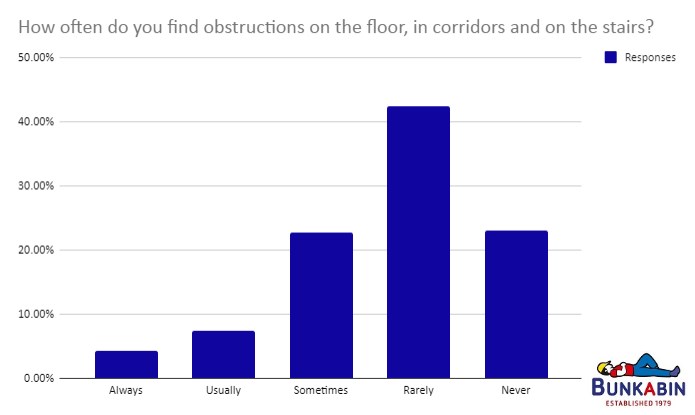
How often do you find obstructions on the floor, in corridors and on the stairs?
Answer Choices
Responses
Always
4.35% (31)
Usually
7.44% (53)
Sometimes
22.75% (162)
Rarely
42.42% (302)
Never
23.03% (164)
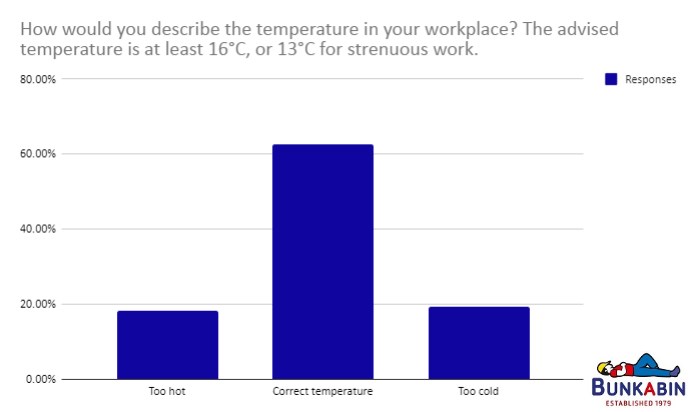
How would you describe the temperature in your workplace? The advised temperature is at least 16°C, or 13°C for strenuous work.
Answer Choices
Responses
Too hot
18.12% (129)
Correct temperature
62.64% (446)
Too cold
19.24% (137)
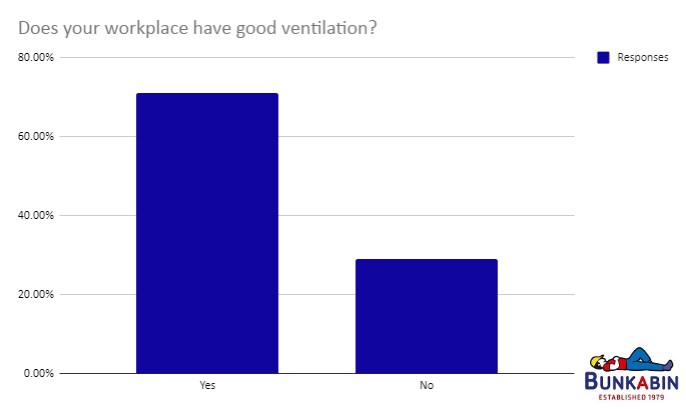
Does your workplace have good ventilation?
Answer Choices
Responses
Yes
71.07% (506)
No
28.93% (206)
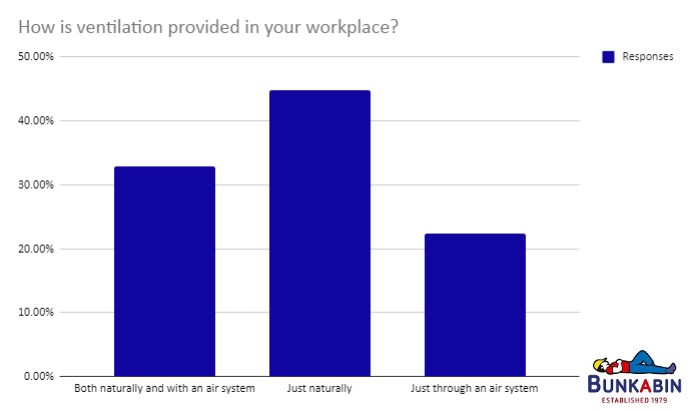
How is ventilation provided in your workplace?
Answer Choices
Responses
Both naturally and with an air system
32.87% (234)
Just naturally
44.80% (319)
Just through an air system
22.33% (159)
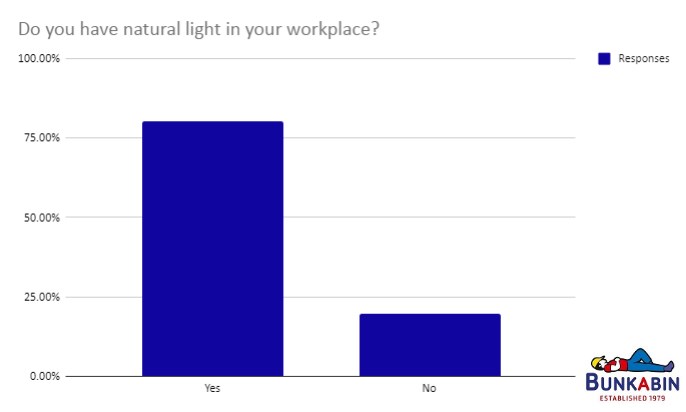
Do you have natural light in your workplace?
Answer Choices
Responses
Yes
80.34% (572)
No
19.66% (140)
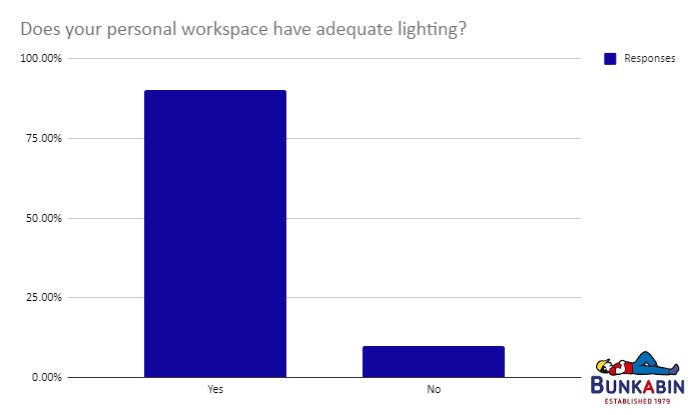
Does your personal workspace have adequate lighting?
Answer Choices
Responses
Yes
90.17% (642)
No
9.83% (70)
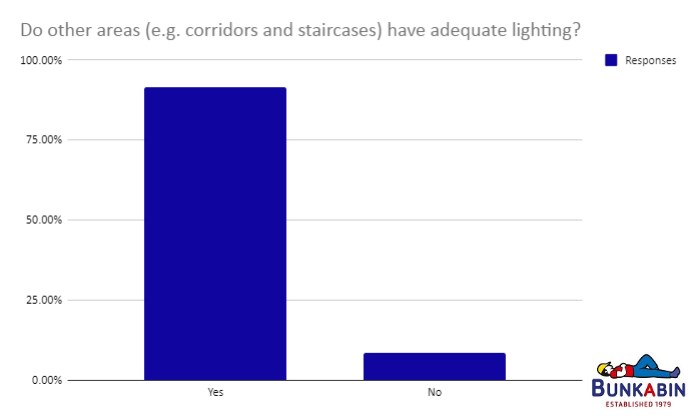
Do other areas (e.g. corridors and staircases) have adequate lighting?
Answer Choices
Responses
Yes
91.43% (651)
No
8.57% (61)
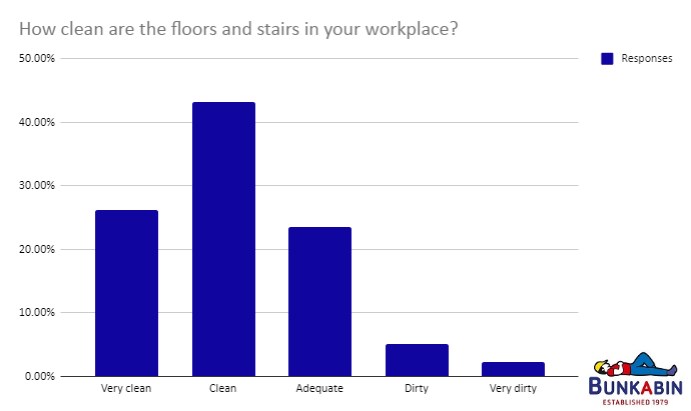
How clean are the floors and stairs in your workplace?
Answer Choices
Responses
Very clean
26.12% (186)
Clean
43.12% (307)
Adequate
23.46% (167)
Dirty
5.06% (36)
Very dirty
2.25% (16)
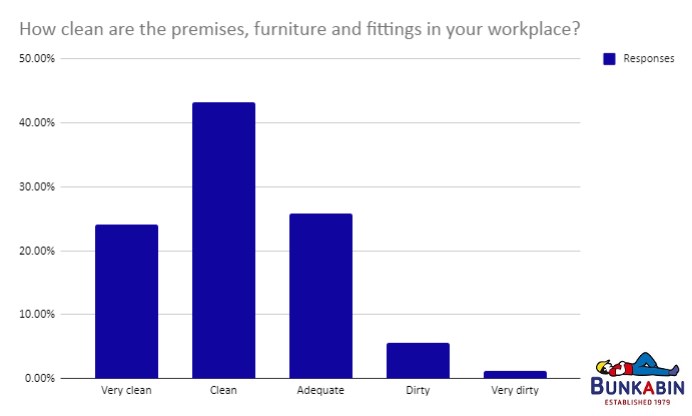
How clean are the premises, furniture and fittings in your workplace?
Answer Choices
Responses
Very clean
24.02% (171)
Clean
43.26% (308)
Adequate
25.84% (184)
Dirty
5.62% (40)
Very dirty
1.26% (9)
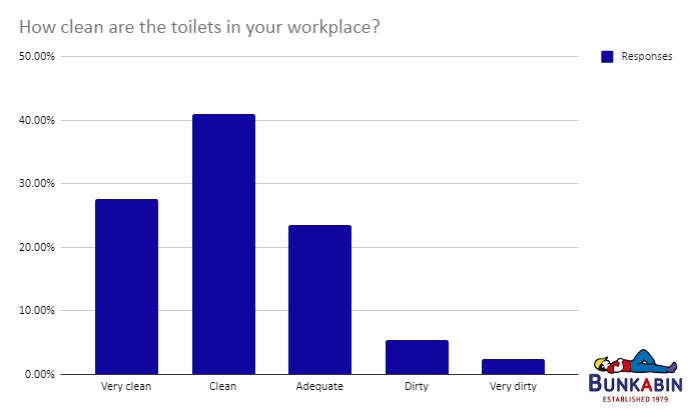
How clean are the toilets in your workplace?
Answer Choices
Responses
Very clean
27.67% (197)
Clean
41.01% (292)
Adequate
23.46% (167)
Dirty
5.48% (39)
Very dirty
2.39% (17)
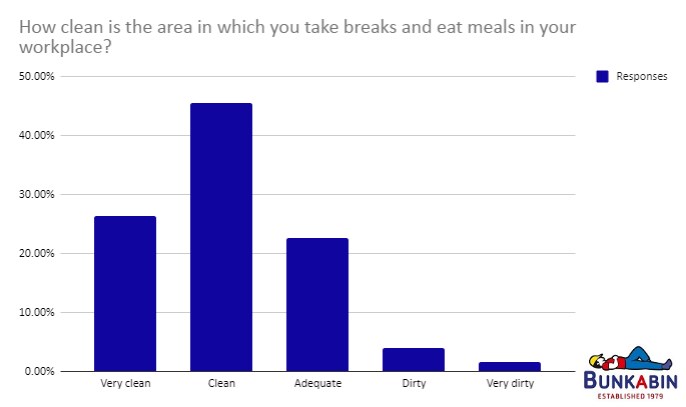
How clean is the area in which you take breaks and eat meals in your workplace?
Answer Choices
Responses
Very clean
26.40% (188)
Clean
45.51% (324)
Adequate
22.61% (161)
Dirty
3.93% (28)
Very dirty
1.54% (11)
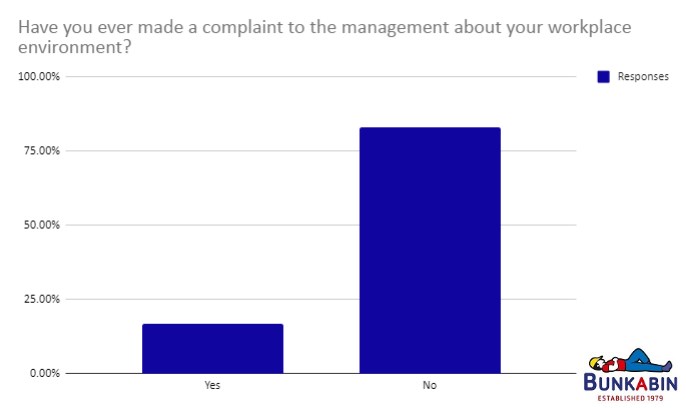
Have you ever made a complaint to the management about your workplace environment?
Answer Choices
Responses
Yes
16.85% (120)
No
83.15% (592)
What was your complaint regarding?
Answer Choices
Responses
The physical workplace
23.53% (28)
Air and temperature
42.02% (50)
Lighting
7.56% (9)
Cleanliness
20.17% (24)
Other
6.72% (8)
How well do you feel your complaint was handled by your managers?
Answer Choices
Responses
Very well - my complaint was listened to carefully and taken very seriously
17.65% (21)
Well - my complaint was acknowledged sufficiently
28.57% (34)
Not very well - my complaint was received, but not taken very seriously
38.66% (46)
Not at all well - my complaint was completely ignored
15.13% (18)
How well do you feel your complaint was addressed?
Answer Choices
Responses
Very well - action was taken that addressed my complaint very effectively
18.49% (22)
Well - action was taken that addressed my complaint to some degree
30.25% (36)
Not very well - the actions taken to address my complaint have been minimal or insufficient
31.09% (37)
Not at all well - my complaint was ignored and no action was taken
20.17% (24)
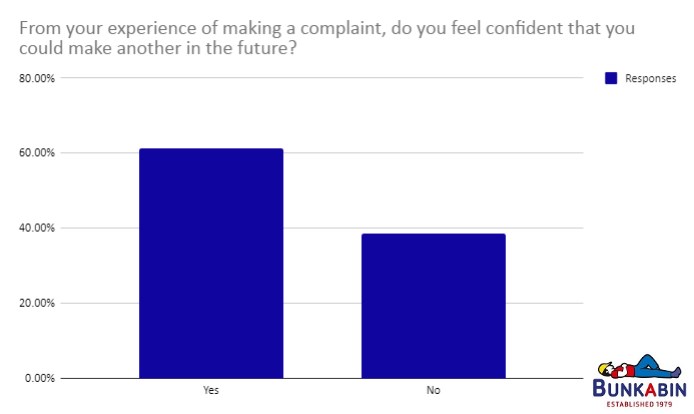
From your experience of making a complaint, do you feel confident that you could make another in the future?
Answer Choices
Responses
Yes
61.34% (73)
No
38.66% (46)
Do you know the procedure to make a complaint about your workplace?
Answer Choices
Responses
Yes
75.30% (445)
No
24.70% (146)
Testimonials
We approached Bunkabin in 2015 to deliver a turnkey accommodation solution for our performers from around the world who were performing at Her Majesty The Queen’s 90th Birthday Celebrations at Windsor this year. Subsequently 200 Bunkabins were ordered and work started on the planning of such a major logistical operation. In 22 days, 200 Bunkabins, complete with bedding kits, were delivered and installed and when our performers arrived they were amazed that we could offer an on-site solution that offered everything they needed. It made for a real village atmosphere with all nations joining together and we couldn’t have asked for more.
Bunkabins drivers were amazing – taking great care when loading and offloading not to damage the grass in the Private Grounds of Her Majesty The Queen and all in all the Bunkabins worked perfectly
Nick Brooks-Ward, H Power Group - Event Planning Services
Over the last 6 years we have increased the Student Village from initially 30 up to currently 274 en-suite Student Sleepers. The Student Village Company provide us with a flexible accommodation capacity, so as long as we have land available, we no longer need to turn away a student because of accommodation shortages.
It is very difficult to predict exact intake numbers however The Student Village Company are able to provide additional capacity only a few weeks before freshers week. The decking, canopy and decals make an enormous difference. The students love them.
While Bunkabins aren’t complicated... There will undoutedly be a raft of questions you will need answering. So with this in mind, we have compiled a list of the most frequently asked ones and, handily, provided the answers to boot.
The aim was to find an accommodation solution that could be deployed quickly and safely, while exceeding industry standards of electrical, fire and structural safety and providing a comfortable living…
As a successful agricultural business, Valley Produce depends heavily on having the right onsite accommodation solutions in place for its seasonal workers. Bunkabin has been able to provide those…
How do you solve an issue of having more students arriving than you have available accommodation? Bunkabin works with Reaseheath College to support them as they expand,enabling them to grow their…
The Royal Navy found themselves requiring 302 more bed than they had available. Rather than costly and time-consuming building work being initiated an alternative tempory solution was sort and…
Her Majesty’s 90th Birthday Party was a celebration of The Queen’s life and involved more than 1,500 participants from around the United Kingdom and the World. It focused on her love of horses, her…
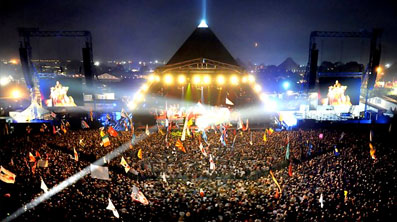
Bunkabin has long had a great working relationship with Glastonbury Festival. Our sleepers and shower blocks offer their management, staff and the supply personnel the comfortable environment they…